 Jeremy Wayne Howell
The Silent Revenue Killer: Why Your Server's First Breath Matters
Most founders treat website speed as a technical detail — something to hand off to a developer and forget. But here's what the data actually shows: before a single word of your copy is read, before your offer is seen, before any buying decision is even possible, your server has already made a first impression.
And your visitor has already felt it.
A slow server response doesn't just frustrate users. It quietly signals uncertainty. It erodes trust before the relationship begins. Research consistently shows that faster server responses improve conversion rates, reduce bounce rates, and directly influence how search engines rank your site. Google's Core Web Vitals framework treats server response time as a foundational signal — not a nice-to-have.
The problem isn't that founders don't care about speed. It's that most don't know where the slowness actually lives — or how to measure it objectively.
That's exactly what this guide is for.
I'm Jeremy Wayne Howell, a revenue growth strategist with over 20 years of experience helping founders diagnose the hidden friction points that stall growth — including the technical performance gaps that silently cost them customers before they ever check website server response time on their own site. If you've ever suspected your site is slower than it should be but weren't sure where to start, this guide will give you a clear, practical path forward.

When a user clicks your link, a psychological "certainty gap" opens. They are waiting for the server to prove that the destination is worth their time. If that first breath—the initial response from your server—takes too long, the brain instinctively flags the experience as high-effort or unreliable. At The Way How, we look at this through the lens of human behavior: a slow site isn't just a technical failure; it is a breakdown in the customer journey that creates immediate friction and stalls revenue momentum.
Understanding the Anatomy of a Server Response
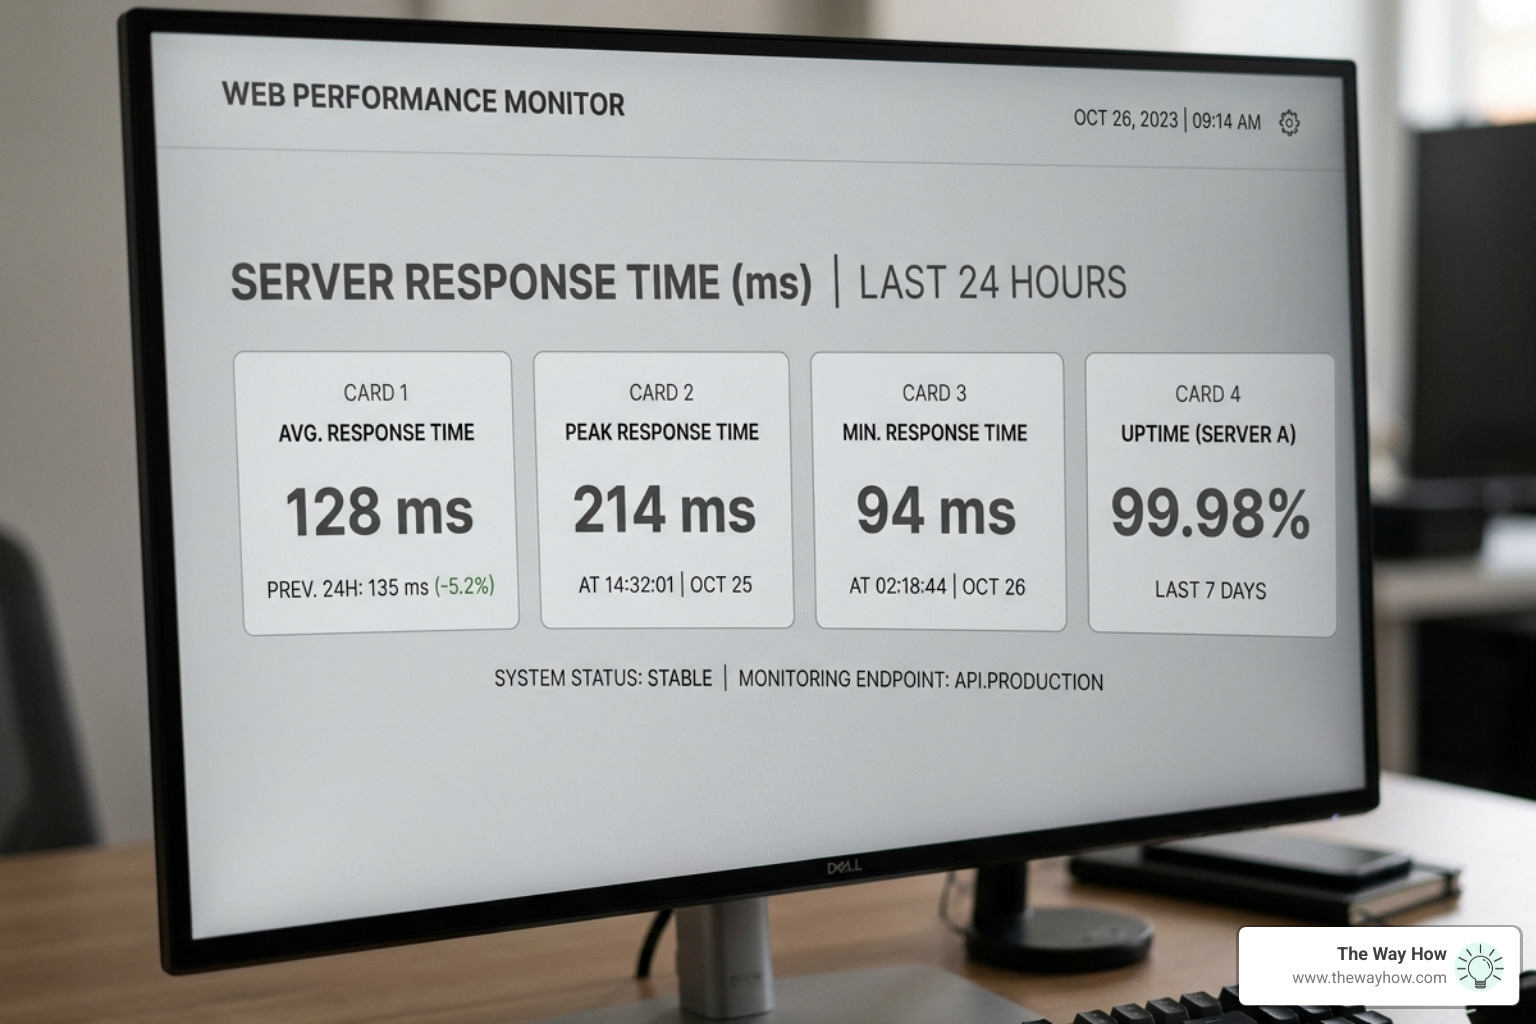
To fix a problem, we must first see it clearly. When you check website server response time, you aren't just looking at one number. You are looking at a relay race of digital events.

The most critical metric here is Time to First Byte (TTFB). This measures the duration from the moment a browser sends a request until it receives the very first byte of data back from the server. It is the definitive "handshake" between your visitor and your brand.
However, several invisible steps happen before that first byte arrives:
- DNS Lookup: The time it takes to translate your domain name (like thewayhow.com) into an IP address.
- TCP Connect: The initial connection established between the user's device and your server.
- TLS Handshake: If you use HTTPS (which you should), this is the security negotiation that ensures the connection is encrypted.
- Server Processing: This is the "thinking" time. The server queries the database, runs scripts, and prepares the HTML.
It is vital to understand that server response time is distinct from "full page load time." While page load involves downloading images and scripts, the server response time is strictly about how quickly the engine starts. You can learn more about how these technical elements converge in our guide on Understanding how page speed impact SEO strategies.
If you want to see where your specific bottlenecks lie, you can use the Server Response Time Checker – Free TTFB Test Tool to get a granular breakdown of these phases.
How to Check Website Server Response Time Like a Pro
Measuring speed from your own office is a common mistake. Because you are physically close to your server (or your browser has cached the site), it might feel fast to you while feeling agonizingly slow to a potential client in London or Singapore.

To get an objective diagnosis, you need to test from multiple global locations. Professional tools use "nodes" or servers stationed around the world to simulate real users.
Benchmarks for Success
What should you aim for? Based on industry standards and Google's recommendations, here is how to grade your results:
- Fast (A+ Rating): A global average of 180ms or less. This is the gold standard achieved by high-performance hosts like Hostinger (136ms) or GreenGeeks (118.6ms).
- Good: Between 200ms and 500ms. This is the threshold Google considers healthy for a positive user experience.
- Needs Improvement: Between 500ms and 1000ms. At this stage, you are likely losing a percentage of your mobile traffic.
- Poor: Anything over 1000ms. This indicates serious server-side bottlenecks that make achieving good Core Web Vitals nearly impossible.
For a quick and reliable global check, we recommend using the tool at Bitcatcha. It tests your site from 10 global locations, including the US, London, Singapore, and Sao Paulo, providing a clear A+ to E rating. You should also cross-reference these results by learning how to check site speed on Google PageSpeed to see how Google perceives your authority.
Using Free Tools to Check Website Server Response Time
There is no shortage of tools to help you diagnose your server's health. Here are the ones we trust to provide the most strategic clarity:
- GTmetrix: This is a powerhouse for performance engineers. It provides Lighthouse metrics and Web Vitals (LCP, TBT, CLS) alongside a detailed "Waterfall" chart. You can start testing at GTmetrix | Website Performance Testing and Monitoring.
- WebPageTest: Often called the "gold standard," this tool allows for advanced diagnostics, including video capture of the loading process and deep metrics on DNS, TCP, and TLS.
- Larm.dev: Excellent for seeing how your site performs across different regions. Use their Website Response Time Checker — Test From Multiple Global Locations to identify if your slowness is a global issue or a regional one.
- Pingdom: Known for its user-friendly interface, it breaks down every element on your page and assigns a performance grade, making it easy to spot "heavy" files.
Diagnosing the Bottlenecks: Why Is Your Server Slow?
If you check website server response time and find it's lacking, don't panic. Slowness is usually a symptom of one of four specific "certainty gaps" in your infrastructure:
- Inadequate Hosting Hardware: If you are on a "cheap" shared hosting plan, you are essentially sharing a single engine with hundreds of other websites. When their traffic spikes, your performance drops.
- Bloated Database Queries: This is common in WordPress sites with too many plugins. Every time a page loads, the server has to "ask" the database hundreds of questions. To mitigate this, see our guide on how to optimize WordPress to speed up your website.
- Lack of Caching: Without caching, your server has to build your website from scratch for every single visitor. Caching allows the server to store a "snapshot" of the page, reducing response times from 800ms to under 50ms.
- Physical Distance: The speed of light is a real constraint. If your server is in New York and your visitor is in Sydney, there is a minimum "network latency" of about 80ms just for the data to travel back and forth.
| Response Time | Rating | Impact on User |
|---|---|---|
| < 180ms | Excellent | Instantaneous feel; high trust. |
| 200 - 500ms | Good | Smooth experience; standard for SEO. |
| 500 - 1000ms | Average | Noticeable delay; slight bounce increase. |
| > 1000ms | Poor | High frustration; significant revenue loss. |
The Role of CDNs in Optimizing Your Check Website Server Response Time Results
The most effective way to solve the "distance" problem is a Content Delivery Network (CDN). A CDN like Cloudflare or Akamai takes your website's content and distributes it to hundreds of "edge servers" around the world.
When a user in London visits your site, the CDN serves the data from a London-based server rather than waiting for your main server in the US to respond. This reduces the geographic latency to near-zero. Furthermore, modern CDNs can handle image optimization on the fly. For more on this, check out our step-by-step guide for better site performance via image optimization.
Frequently Asked Questions about Server Performance
When founders begin to dive into these metrics, a few common questions always surface.
What do HTTP response codes mean?
When you test your site, you'll see three-digit codes. These are the server's way of telling you its status:
- 200 OK: The server successfully processed the request. This is what you want.
- 301/302 Redirect: The page has moved. Be careful here—"redirect chains" (where one redirect leads to another) can add hundreds of milliseconds to your response time.
- 4xx (e.g., 404): Client error. The page wasn't found or was restricted.
- 5xx (e.g., 500, 503): Server error. Your server is overwhelmed or has a configuration flaw.
What is a good TTFB for SEO?
Google is quite transparent about this. Within the Core Web Vitals framework:
- 0–200ms is considered Excellent.
- 200–500ms is Good.
- 500–1000ms Needs Improvement.
- Over 1000ms is Poor and will likely negatively impact your rankings.
How does server response differ from page load time?
Think of server response time as the time it takes for a waiter to acknowledge you and take your order. Page load time is the time it takes for the food to actually arrive at your table. You can't have a fast meal if the waiter takes ten minutes to show up.
Can I track server response time continuously?
Yes, and you should. Tools like Pingdom, UptimeRobot, or Host Tracker can monitor your site every minute. They will alert you the moment your server slows down or goes offline, allowing you to fix issues before they impact your revenue.
From Technical Friction to Revenue Momentum
At The Way How, we believe that every technical detail is a psychological touchpoint. When you check website server response time, you aren't just looking for a faster site; you are looking to remove uncertainty from the buyer's journey.
If your website is slow, it creates a "certainty gap" that no amount of clever copywriting can fix. By diagnosing these bottlenecks and optimizing your server's performance, you move from a state of technical friction to one of revenue momentum. You create a system that is dependable, trustworthy, and ready to convert.
We help founders and leadership teams move past the "tactics of the week" and focus on the strategic clarity that drives predictable growth. Whether it's through Fractional CMO leadership or refining your technical architecture, our goal is to turn your marketing into a dependable engine.
If you are ready to stop chasing symptoms and start diagnosing the root causes of stalled growth, we invite you to explore more info about our services. Let’s remove the uncertainty together.


