
A score of 56 on mobile. That’s what PageSpeed Insights gave our own homepage on October 7, 2026, with a Largest Contentful Paint of 14.0 seconds.
I’m Jeremy Wayne Howell, founder of The Way How. We build sites for a living, so we didn’t love that number. This guide is how we read the report, what we ignored, and what moved it.
How to Run PageSpeed Insights
The PointRun the Mobile report on the pages that earn your traffic, and read the field data before you look at the score.
If you just need the quick answer:
The steps:
- Go to pagespeed.web.dev and paste the full address of 1 page. Test the pages that bring in traffic or leads, not only your homepage.
- Click Analyze and wait for the report.
- Stay on the Mobile tab. Google’s documentation says the mobile run simulates a mid-tier phone on a mobile network, so it’s the test that shows problems first. Switch to Desktop afterward.
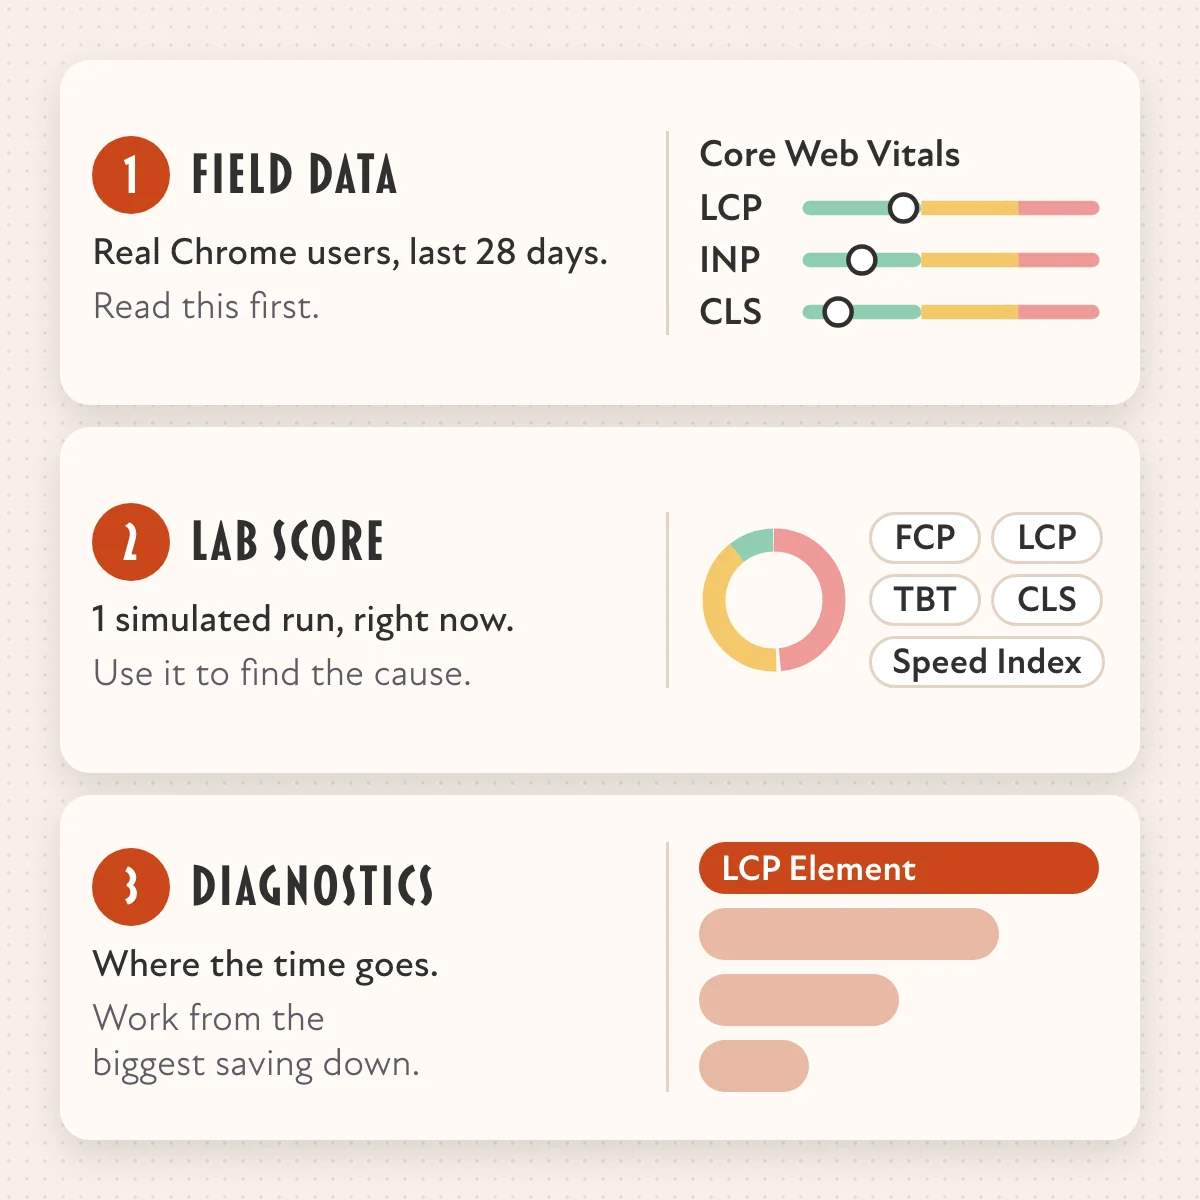
- Read the Core Web Vitals Assessment at the top before anything else. That’s field data, and it says Passed or Failed.
- Scroll to the lab score and the list of diagnostics underneath it. Work from the biggest saving down.
You don’t need a private window for this tool. Google’s servers run the test, so your browser extensions and cache can’t touch it. A private window does matter when you run Lighthouse inside Chrome DevTools, because that runs on your own machine.
Field Data vs Lab Data: Which Number To Trust
The PointField data is what real Chrome users felt over the last 28 days. Lab data is 1 simulated run. Judge your site with field data, and debug it with the lab report.
PageSpeed Insights shows 2 different kinds of data on 1 page:
| Field data | Lab data | |
|---|---|---|
| Where it comes from | Real Chrome users, through the Chrome User Experience Report | A simulated Lighthouse run |
| Time window | The previous 28 days | 1 run, right now |
| Who is in it | Chrome users who opted in to share it | A simulated mid-tier phone, or a desktop on a wired connection |
| Metrics | LCP, INP, CLS (plus FCP and TTFB) | FCP, LCP, Speed Index, CLS, Total Blocking Time |
| Best used for | Judging how your site performs | Finding what to fix |
For the mobile lab run, Lighthouse throttles the network to a simulated Slow 4G connection and applies a 4x CPU slowdown. That’s why a page that feels instant on your office laptop can still score badly in the report.
To pass Core Web Vitals, the 75th percentile of your field data has to land in the “Good” range for each metric:
- Largest Contentful Paint (LCP): under 2.5 seconds. It marks when the main content, usually a hero image or a headline, has loaded.
- Interaction to Next Paint (INP): under 200 milliseconds. It measures how long the page takes to respond after a tap or a click.
- Cumulative Layout Shift (CLS): under 0.1. It measures how much the page jumps around as it loads.
If INP has too little data, PageSpeed Insights passes you on LCP and CLS alone. In the standard report INP shows up only in field data, because it needs a real person tapping. The lab score uses Total Blocking Time as the stand-in.
In our view, field data is the number you report, and lab data is the number you debug with. When they disagree, believe the field data, then use the lab report to work out why.
What the Score Is Made Of
The 0 to 100 score is a weighted average of 5 lab metrics. In Lighthouse 10, the current weighting on Google’s scoring page, Total Blocking Time carries 30% of the score, Largest Contentful Paint and Cumulative Layout Shift 25% each, and First Contentful Paint and Speed Index 10% each.
Lighthouse performance scoring. Chrome for Developers, 2026-10. Read the Source →Bands: 0 to 49 is Poor, 50 to 89 is Needs Improvement, 90 to 100 is Good.
2 things follow from that. JavaScript that keeps the browser busy (Total Blocking Time) is the single heaviest lever. And a page can score 90 and still fail Core Web Vitals, because the score comes from the lab and the pass comes from the field.
What We Fixed on Our Own Site: Score 56 to 91
The PointOur homepage went from 56 to 91 in 1 day. Cutting the biggest file didn't move load time. Fixing the Largest Contentful Paint element did.
These are our numbers, from our own site, taken from our own test runs on October 7, 2026.
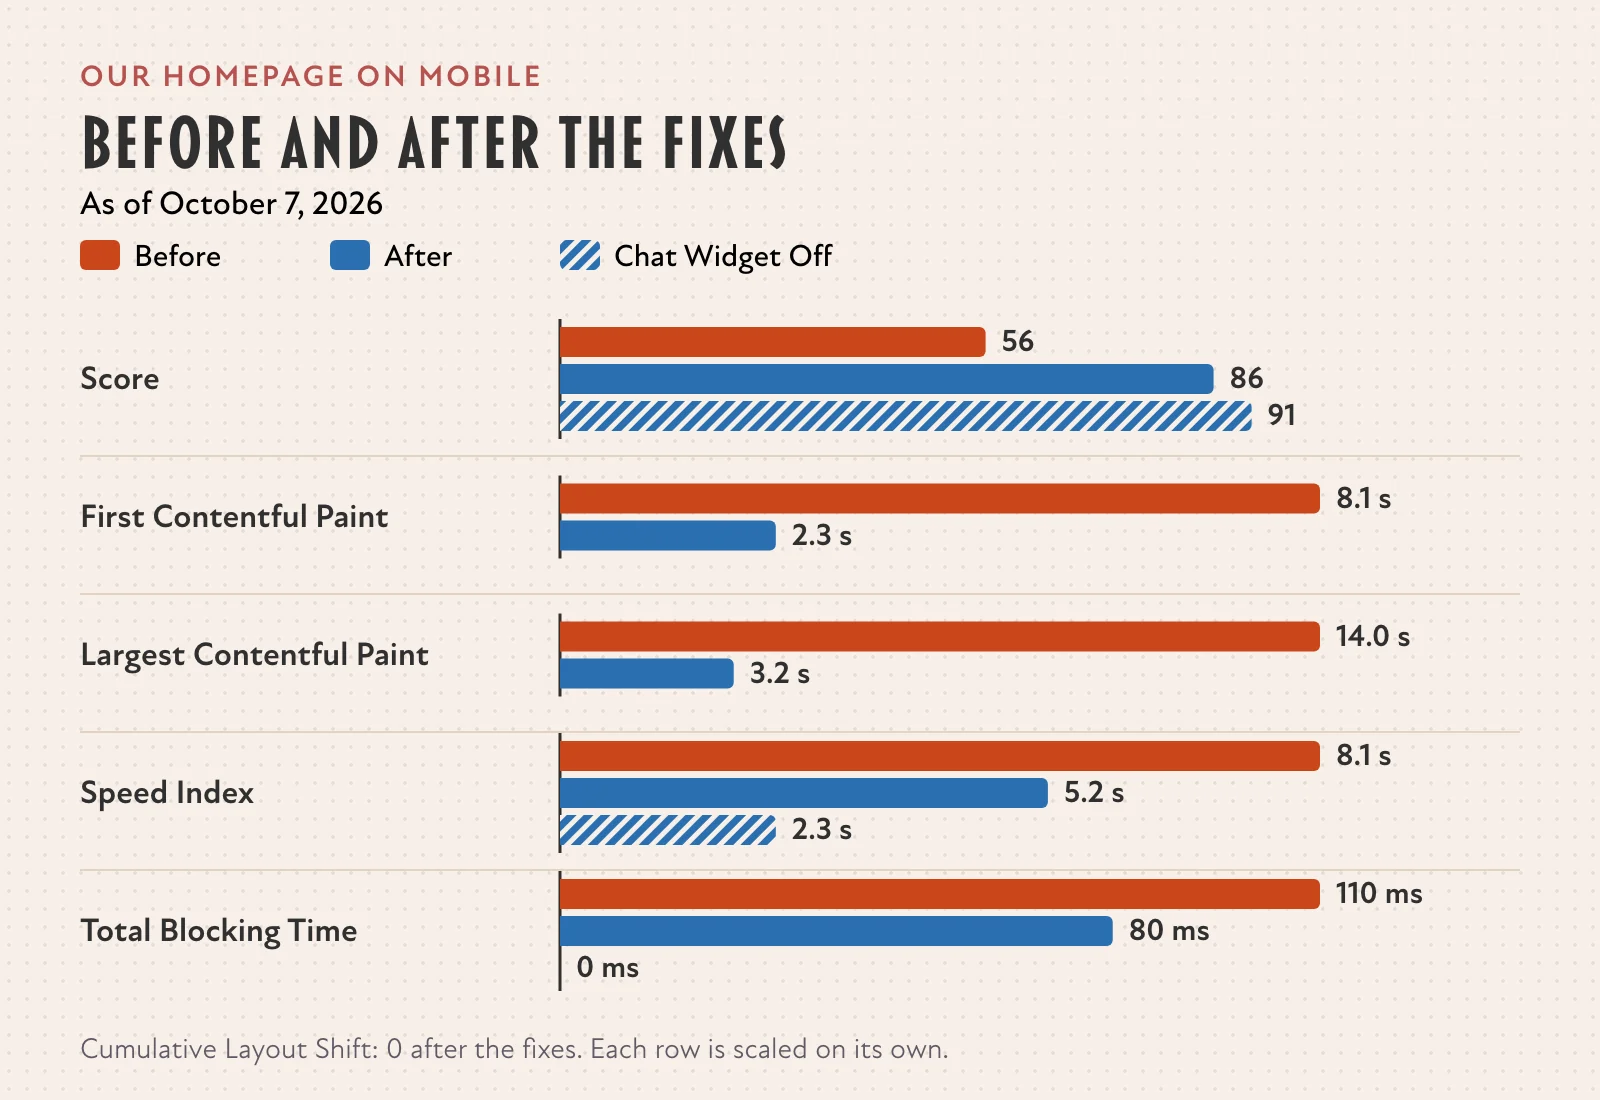
We ran PageSpeed Insights on the live homepage, mobile. It scored 56, with First Contentful Paint at 8.1 seconds, Largest Contentful Paint at 14.0 seconds, Speed Index at 8.1 seconds and Total Blocking Time at 110 milliseconds.
After a round of fixes the same test read 86: First Contentful Paint 2.3 seconds, Largest Contentful Paint 3.2 seconds, Speed Index 5.2 seconds, Total Blocking Time 80 milliseconds and Cumulative Layout Shift 0. Then we turned off a chat widget nobody was using, and it read 91.
3 things we learned along the way:
- The biggest file wasn’t the bottleneck. An autoplay background video weighed 8.47 MB. We replaced it with a CSS pattern, and the page dropped from 11,898 KiB to 3,631 KiB. In our local Lighthouse runs, LCP stayed at about 7.1 seconds (7.06 before, 7.14 after). The LCP element was an image, not the video. LCP only moved after the speed pass that fixed how that image, the fonts and the tracking script loaded.
- Third-party scripts cost more than they look. We deferred our HubSpot tracking script until after the first paint. Across 7 runs, what was left still added 27 to 38 milliseconds of Total Blocking Time and 160 to 224 KiB of weight. Our Best Practices score read 75 with it and 100 without, because of a cookie set by the script’s host.
- We aren’t done. As of October 7, our LCP was 3.2 seconds, still over the 2.5 second line. The remaining gap is ours: about 45 high-priority requests, 8 font files and 22 JavaScript chunks.
What to Fix First
The PointFix the Largest Contentful Paint element first, then third-party scripts and layout shifts. Skip chasing a perfect 100.
Work in this order. Each step is a place to look in the report.
- The Largest Contentful Paint element. The diagnostics name it. If it’s an image, make sure it’s sized for the screen, in a modern format like WebP or AVIF, loaded with
fetchpriority="high", and not lazy-loaded. - Third-party scripts and heavy JavaScript. Total Blocking Time carries the most weight in the score. Delete what you don’t use, and load the rest after the first paint.
- Layout shift. Add
widthandheightto images and video so the browser reserves the space before they load. - Render-blocking files and fonts. Defer scripts that aren’t needed for the first screen, and don’t load fonts that the page never shows.
- Server response time. If the first byte is slow, everything after it is slow too. Our guide to checking your website’s server response time covers it.
For how speed fits into the rest of your SEO work, see page speed for SEO. For other ways to test, see our site speed checker guide.
Run It From a Script: The PageSpeed Insights API
If you have more than a handful of pages, run the tool from a script. The API returns both the lab results (lighthouseResult) and the field data (loadingExperience) as JSON:
curl "https://www.googleapis.com/pagespeedonline/v5/runPagespeed?url=https%3A%2F%2Fexample.com&strategy=mobile&category=performance&key=YOUR_API_KEY"Get a key from the Google Cloud console. Without one you share an anonymous quota with everyone else, and it runs out. We got 429 Quota exceeded for quota metric 'Queries' on October 5, October 7 and October 20, 2026.
Run each URL 3 to 5 times and keep the median. Google’s Lighthouse docs say the median of 5 runs is twice as stable as a single run. Google’s PageSpeed Insights API guide has the full parameter list.
What PageSpeed Insights Cannot Test
PageSpeed Insights can’t see localhost, a staging site behind a password, or a page that needs a login. Open the page in Chrome, then use the Lighthouse tab in DevTools. This is where a private window helps, because your extensions would otherwise change the result.
If you’d like a second pair of eyes on your own report, that’s what our free audit is for.
We’re a HubSpot Solutions Partner. We make money when businesses buy HubSpot through us or hire us to set it up. We still think it’s the right pick for most teams.
Independent of HubSpot, Inc.; not authorized, endorsed or sponsored by HubSpot, Inc.