Jeremy Wayne Howell
Beyond the Surface: Why Your Growth is Stalled in the Friction Gap
A pain point map is a visual diagnostic tool that identifies the specific moments in your customer journey where frustration, confusion, or friction causes people to disengage, stall, or leave.
Here's what it does at a glance:
| Element | What It Captures |
|---|---|
| Where | The exact stage in the journey where friction occurs |
| What | The type of pain — process, support, financial, or effort |
| How bad | The severity and frequency of each friction point |
| So what | The business impact: lost revenue, churn, or stalled conversions |
Pain point maps are used to diagnose friction before investing in fixes — so teams spend resources on problems that actually matter.
Most businesses know their customers are frustrated. What they don't know is where the frustration starts, why it keeps happening, and which friction points are silently costing them the most revenue.
That's the gap a pain point map is designed to close.
A customer journey map shows you the steps someone takes. A pain point map shows you where those steps hurt — and how badly. It goes beyond tracking touchpoints to diagnosing the emotional and operational friction that quietly erodes trust, delays decisions, and drives customers toward competitors.
The research is clear: in crowded markets where products are increasingly similar, customer experience is often the only real differentiator. Yet most teams are still guessing at what's broken — defaulting to whoever argues loudest in the room, or patching symptoms without ever diagnosing the root cause.
This guide will change that.
I'm Jeremy Wayne Howell, founder of The Way How, and over 20 years of working with founders and revenue teams I've seen how a well-built pain point map consistently reveals the hidden friction that explains why growth stalls — even when tactics appear to be working. Let's get into the diagnosis.

When growth plateaus, our instinct is often to "do more." More ads, more content, more features. But in April 2026, we find that growth rarely stalls because of a lack of tactics. It stalls because of the "Friction Gap"—the space between what your customer expects and what they actually experience.
At The Way How, we look at this through the lens of buyer psychology. Every time a customer encounters a hurdle—whether it's a confusing pricing page or a slow support response—they experience a "certainty gap." Their brain begins to weigh the effort of continuing against the potential reward. If the friction is too high, the brain chooses safety: they stop.
A pain point map allows us to practice "diagnosis before prescription." Instead of guessing which marketing campaign to launch, we identify where the psychological resistance is highest. By mapping these certainty gaps, we can design systems rooted in empathy that restore momentum and create predictable revenue.
What is a Pain Point Map (and Why a Journey Map Isn't Enough)?
It is a common mistake to use these terms interchangeably. While a B2B Customer Journey provides the skeleton of the customer experience, the pain point map provides the nervous system—it tells us where it hurts.
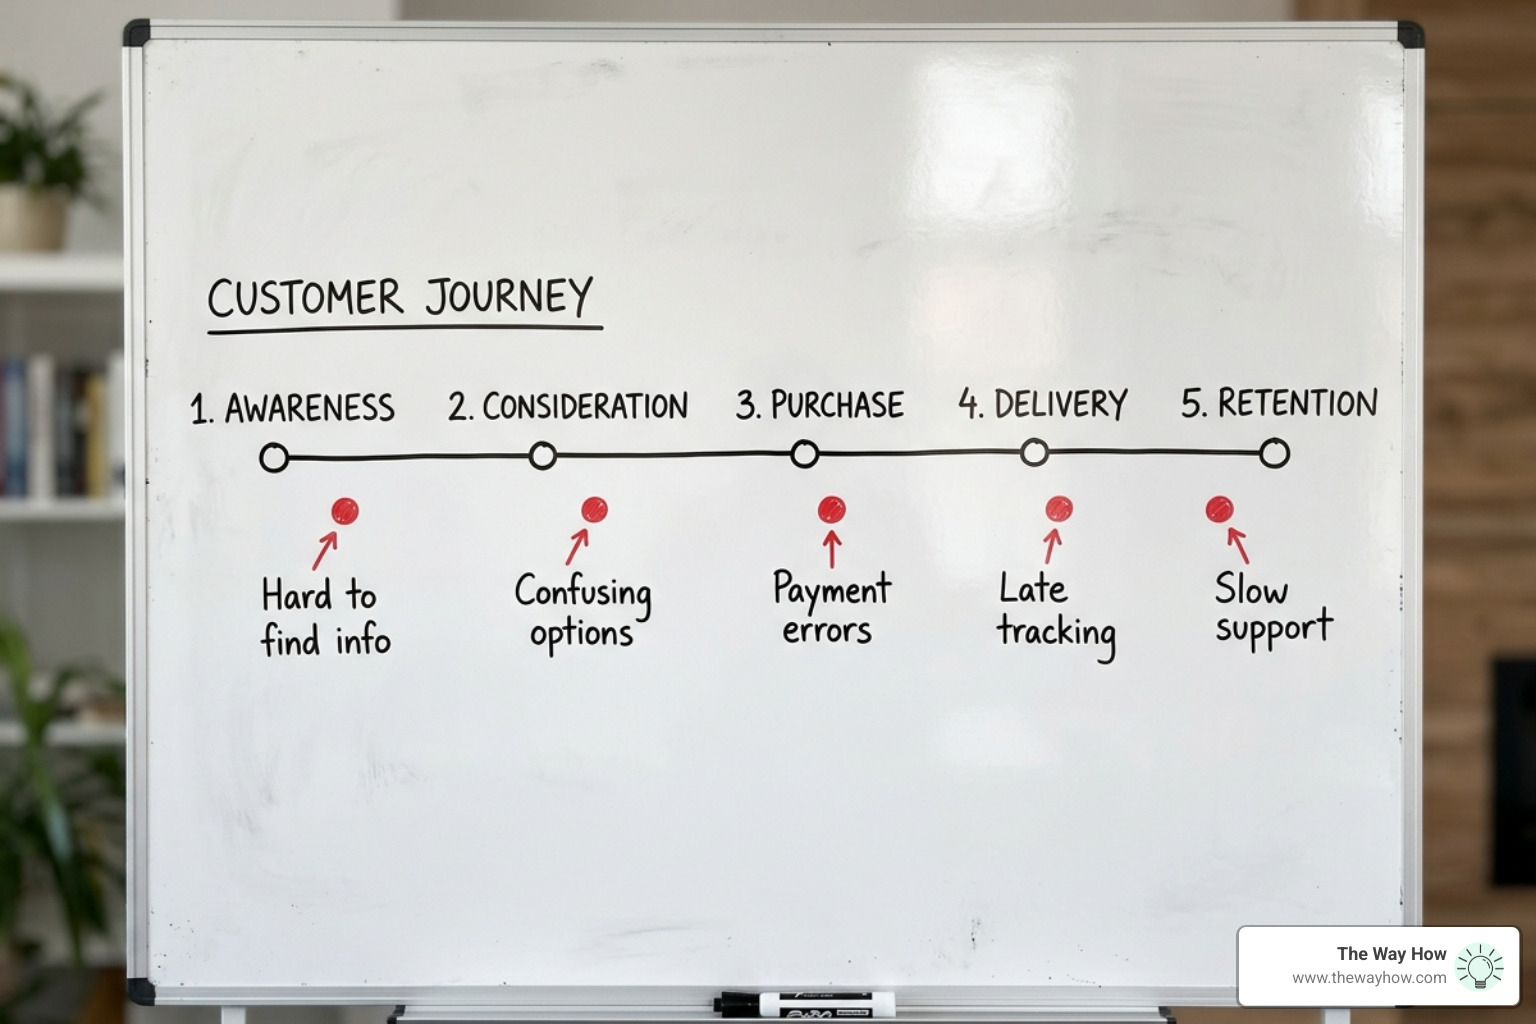
A standard journey map is often a "happy path" document. It lists the stages: Awareness, Consideration, Decision. It tracks touchpoints like "Visited Website" or "Downloaded Whitepaper." But it rarely captures the visceral frustration of a user who can't find a "Reset Password" button or the anxiety of a B2B buyer who doesn't understand your implementation process.
According to Insight7, a pain point map is a strategic visualization that pinpoints these specific challenges. It shifts the focus from what the customer does to how the customer feels and where the industry is blocking their progress.
The Difference Between Tracking Steps and Identifying Pain
Think of a journey map as a GPS route. It shows the turns and the destination. A pain point map is the traffic and weather overlay. It shows you the construction zones and the accidents that make the journey unbearable.
When we perform touchpoint analysis, we aren't just looking for completion rates. We are looking for emotional resonance. If a customer reaches the "Purchase" stage but abandons their cart, the journey map tells us they left. The pain point map tells us they left because the multi-step checkout felt like an interrogation. Understanding these 5 Stages Customer Journey Map through the lens of friction allows us to solve for the human, not just the metric.
Why Businesses Fail to See Industry Blind Spots
Many industries suffer from "status quo bias." We become numb to the friction we impose on our customers because "that's just how it's done."
For example, in the B2B world, long sales cycles and opaque pricing are often accepted as standard. But these are actually significant blocks to buyer utility. When you map out the Customer Journey Stages, you often find that the biggest opportunities for growth lie in solving the "unspoken" pains—the ones your competitors have ignored for a decade.

The Anatomy of Friction: Categorizing the Pains That Kill Conversions
Not all pains are created equal. Some are minor annoyances, while others are "deal-breakers" that trigger immediate churn. To fix them, we must first categorize them.
In psychology-first marketing, we look for things like cognitive load (how hard the customer has to think) and decision fatigue. If your 4 Stages Of Customer Journey require too much mental heavy lifting, the customer will simply opt out.
To determine which issues are worth your capital, we often use a Severity Matrix. This helps distinguish between a customer "whining" and a customer experiencing a problem that has a real economic impact.
Minor vs. Major Chronic Pains
We can categorize friction using physical injury analogies:
- Minor One-Time: Like stubbing a toe. A website glitch or a one-day shipping delay. Annoying, but usually forgiven if the rest of the experience is solid.
- Major One-Time: Like a broken arm. A damaged product or a significant data breach. This requires immediate triage to save the relationship.
- Minor Chronic: Like a persistent dull ache. A clunky login process or a confusing navigation menu. These are dangerous because they build resentment over time, making customers vulnerable to competitors.
- Major Chronic: Like chronic back pain. These are the "loyalty killers"—hours on hold for support or a product that consistently fails to deliver its core value.
Reviewing B2B Customer Journey Map Examples shows that major chronic pains are the leading indicators of churn.
The Four Pillars of Customer Frustration
Most pain points fall into one of four categories:
- Support Pain: Friction during the "help" phase—lack of human support, slow response times, or unhelpful knowledge bases.
- Productivity Pain: The product or service is too complex or takes too much time to use.
- Process Pain: Friction in the "how"—complicated sign-up forms, awkward billing cycles, or difficult return policies.
- Financial Pain: The customer feels they aren't getting a fair exchange of value for their money, or hidden fees are causing "sticker shock."
As noted by Standing Partnership, analyzing these pillars allows businesses to move beyond anecdotes and toward empirical evidence.
Strategic Frameworks: From Buyer Utility to the Severity Matrix
To find truly "Blue Ocean" opportunities, we use the Buyer Utility Map. This framework looks at 36 potential "utility spaces" by crossing the six stages of the buyer experience cycle with six utility levers (like simplicity, risk reduction, and environmental friendliness).
Most industries crowd into one or two spaces—usually "Productivity" in the "Use" stage. By mapping the pain point map against this grid, you can find the 34 other spaces where your competitors are currently blocking utility. This is how you design a Complete Customer Journey that feels like a breath of fresh air to your market.
The ActiFry Case Study: Turning Industry Pain into €1 Billion
A classic example of this is Groupe SEB’s ActiFry. In the early 2000s, the French fry maker market was shrinking by 10% every year. The industry was blind to the pain points: making fries was messy, unhealthy (too much oil), and the machines were a nightmare to clean.
By using a buyer utility map, they identified these "blocks to utility." They developed a product that used only one tablespoon of oil for two pounds of fries—resulting in 40% fewer calories and 80% less fat. By solving the "health" and "cleaning" pain points, they turned a dying category into a €1 billion global success. Even their stock price jumped 5% after Oprah Winfrey tweeted about how much she loved the product.
How to Create a Pain Point Map Using the Buyer Utility Framework
To replicate this success, you must look at the entire buyer experience cycle:
- Purchase: How hard is it to find and buy the product?
- Delivery: How fast and safe is the arrival?
- Use: Does it solve the problem effectively?
- Supplements: Do they need other things to make it work?
- Maintenance: Is it easy to keep running?
- Disposal: Is it easy to get rid of or upgrade?
Building Your Pain Point Map: A Step-by-Step Diagnostic Guide
Creating a pain point map is a collaborative diagnostic process. It requires moving from "I think" to "The data shows."
Gathering Raw Data from the Front Lines
You cannot build a map from an ivory tower. You need raw, unfiltered feedback.
- Customer Interviews: Conduct 15-20 deep-dive interviews. Don't ask "Do you like us?" Ask "Where did you almost give up?"
- Reddit & Social Media Mining: Places like Reddit are gold mines for raw frustration. People vent there in ways they never will on a formal survey.
- Support & Sales Logs: Your front-line teams hear the pain every day. Mine support tickets for "Major Chronic" issues.
- Behavioral Analytics: Use heatmaps and click-tracking to see where users literally get stuck on your site.
Running the Collaborative Mapping Workshop
Once you have the data, bring a cross-functional team together—Marketing, Sales, Support, and Product.
- List the Pains: Use sticky notes to plot every identified frustration onto a wall.
- Map to Journey Stages: Align them with your Journey Map.
- The Scoring Session: Use an impact/effort grid.
- Dot Voting: Have the team vote on which pains are causing the most significant "certainty gaps" for the business.

The Prioritization Filter: Which Pains are Worth Your Capital?
Every journey map surfaces more problems than you can fix. Prioritization is where most teams fail—they fix the "easiest" things or the things the CEO complained about this morning.
To be objective, use a scoring framework based on three dimensions:
- Severity: How much does this hurt the individual customer? (1-10)
- Frequency: How many customers does this affect? (1-10)
- Business Impact: What is the cost of not fixing this? (Churn, lost sales, support overhead).
| Pain Point | Severity | Frequency | Business Impact | Total Score |
|---|---|---|---|---|
| Complicated Checkout | 9 | 8 | 10 | 27 |
| Broken Help Link | 4 | 2 | 2 | 8 |
| No Human Support | 10 | 5 | 9 | 24 |
According to Smaply, simple addition is often more effective than complex weighted formulas for keeping the team aligned.
Avoiding the "Loudest Voice" Bias in Scoring
To prevent "anchoring bias"—where everyone agrees with the most senior person in the room—have team members score the pains individually in a spreadsheet before meeting. If scores for a specific pain point diverge by more than 2 points, use that as a prompt for a "calibration session" to look at the evidence.
Integrating Your Pain Point Map into Product and Content Strategy
Your pain point map should become the North Star for your roadmap.
- Content Strategy: If customers are confused about "Implementation," create a content cluster specifically addressing those fears. This builds certainty before the sale.
- Product Development: Use the map to prioritize features that remove friction, not just add "bells and whistles."
- CX Management: Track "Journey Performance Indicators" (JPIs) to see if your fixes are actually reducing the friction scores over time.
Frequently Asked Questions about Pain Point Mapping
How does pain point mapping differ from Jobs-to-be-Done (JTBD)?
JTBD focuses on the "why"—the underlying functional and emotional goal a customer wants to achieve (e.g., "I want to feel secure in my retirement"). A pain point map focuses on the "what's in the way"—the specific friction points (e.g., "The retirement calculator is too confusing to use") that prevent them from doing that job. JTBD is great for innovation; pain point mapping is essential for optimization.
How often should we update our pain point map?
In the fast-moving landscape of 2026, customer expectations shift rapidly. We recommend a full review of your pain point map quarterly. Additionally, any time you launch a new product, enter a new market, or see a sudden spike in churn, you should revisit the map to see if new friction points have emerged.
What are the most common mistakes in pain point prioritization?
The biggest mistake is relying on internal opinions rather than external data. Another common error is ignoring "Minor Chronic" pains. While they don't cause an immediate fire, they are the "death by a thousand cuts" that lead to long-term brand erosion. Finally, failing to involve sales and support teams—who are the closest to the customer's actual pain—results in a map that is theoretically correct but practically useless.
Restoring Momentum: From Diagnosis to Predictable Growth
At The Way How, we believe that marketing shouldn't be a series of "best guesses." It should be a system designed to remove uncertainty.
When you see your customer's journey clearly—not as a series of steps, but as a series of human emotions and psychological hurdles—you gain the clarity needed to lead. By using a pain point map, you stop chasing tactics and start building the systems that create trust and momentum.
If your growth has stalled and you aren't sure why, it's time to stop guessing. We help leadership teams diagnose these certainty gaps and design revenue engines that work because they are rooted in how humans actually make decisions.

The Definitive Guide to B2B Sales and Marketing Alignment