A Complete Guide to CRM Systems and Database Management
 Jeremy Wayne Howell : Jul 22, 2026 9:48:31 PM

Learning how to use PageSpeed Insights is one of the fastest ways to understand why visitors leave your site before they ever read a word you’ve written.
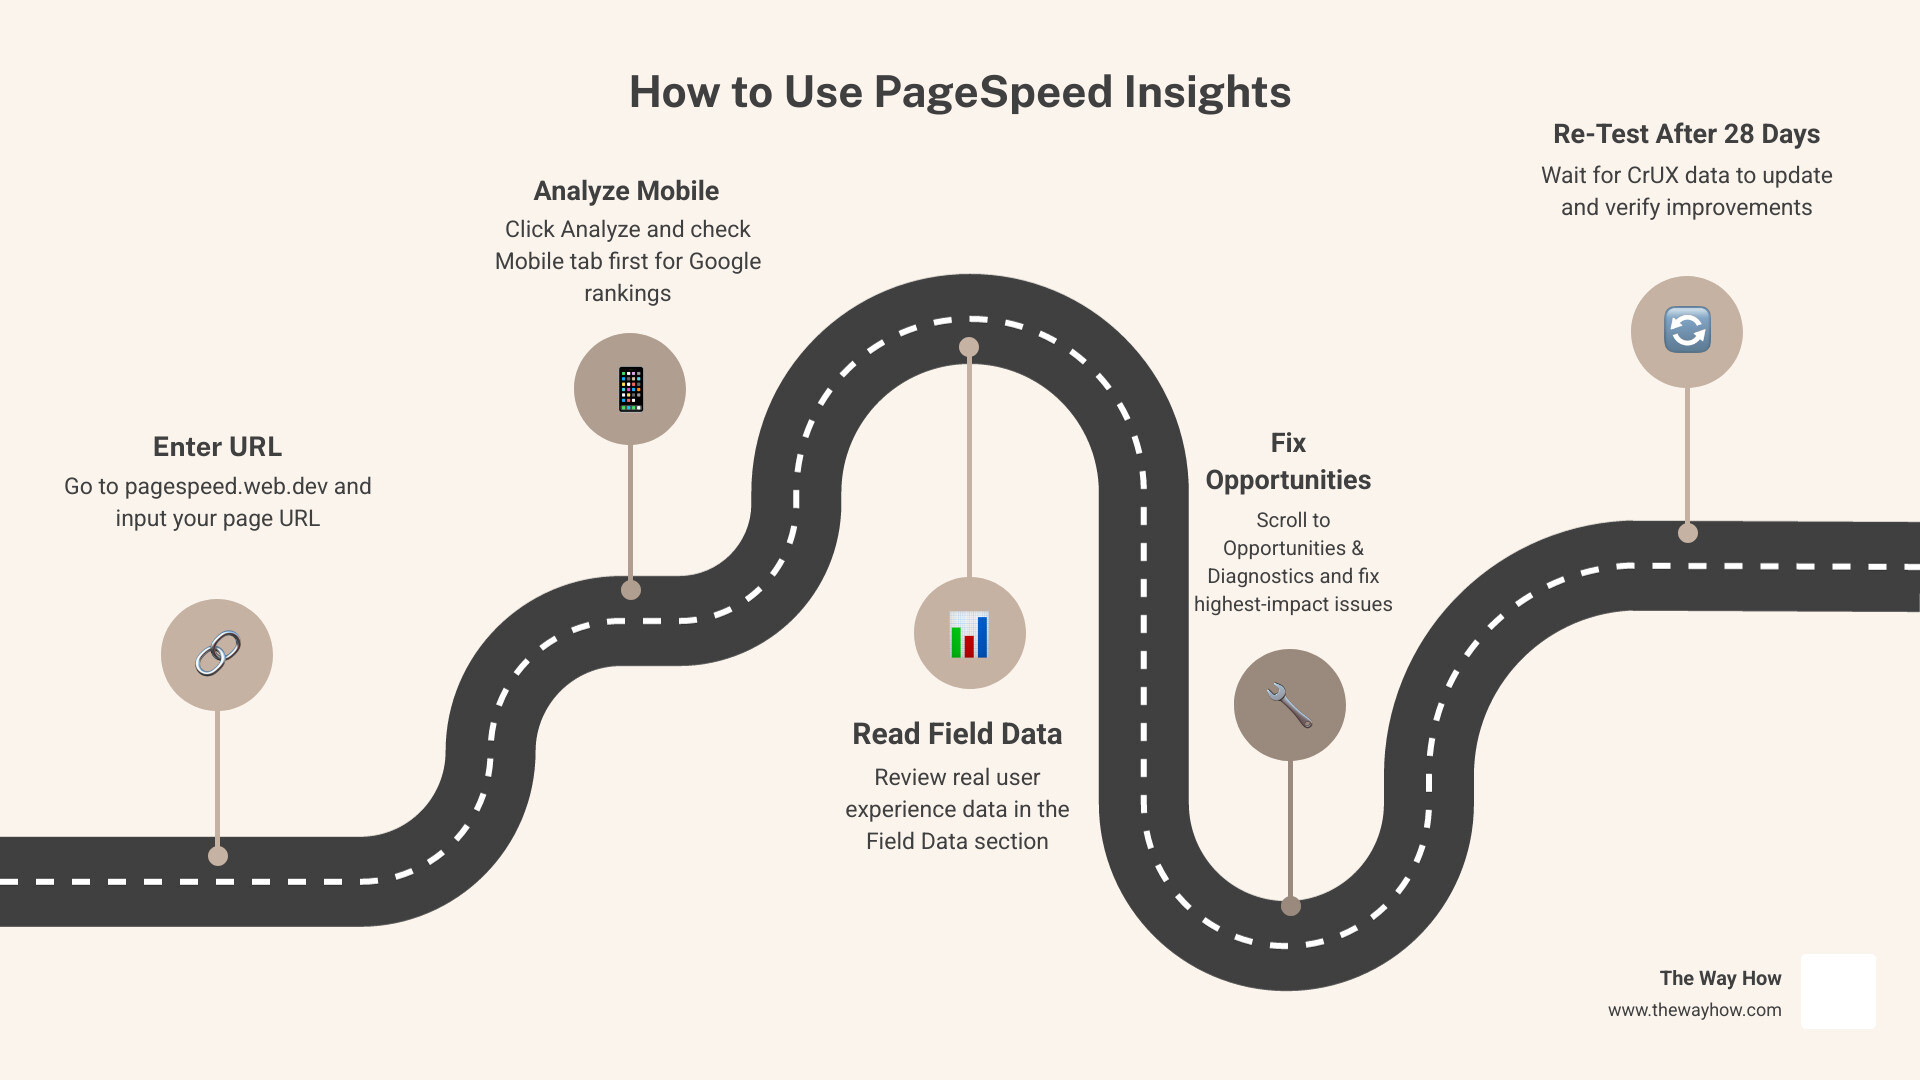
Here’s the quick answer:
That’s the core workflow. But most site owners stop at the score — and that’s where the real problem begins.
A score of 72 or 91 feels meaningful. It isn’t — not on its own. What actually matters is whether your real users are experiencing your site as fast, average, or slow. And those are two very different questions.
Consider this: 53% of mobile visitors abandon a site that takes more than 3 seconds to load. That’s not a technical metric. That’s a trust signal failing in real time — before your value proposition ever lands.
Speed isn’t just a performance issue. It’s a certainty gap. When a page loads slowly, the human brain interprets it as friction, risk, or unreliability. The visitor doesn’t think “this site has render-blocking JavaScript.” They think: “Maybe this isn’t worth my time.”
PageSpeed Insights gives you the data to close that gap — if you know how to read it correctly.
I’m Jeremy Wayne Howell, founder of The Way How, and over 20 years of working with founders and revenue teams I’ve seen slow sites quietly destroy conversion rates long before anyone looks at the analytics. Understanding how to use PageSpeed Insights is where I always start when diagnosing why a technically sound site isn’t generating the revenue it should.
When we analyze user behavior, we look at cognitive load. When a webpage loads instantly, the user experiences a sense of safety and predictability. They feel in control of their journey. But when a page lags, visual elements shift, or buttons refuse to respond to touch, that cognitive load spikes. The user must decide whether to wait or seek a faster, more reliable alternative. In most cases, they leave.
By mastering PageSpeed Insights (PSI), we can look past the arbitrary 0-100 score and diagnose the exact psychological friction points that prevent real-world visitors from converting.
To begin optimizing, we must first learn how to extract the right diagnostic information from the tool. Google PageSpeed Insights is a free web performance diagnostic tool that blends simulated laboratory testing with real-world user performance data. If you want a structured introduction to performance monitoring, our free website speed checker guide 2026 offers an excellent foundation.
When Google crawls and indexes your website, it does so using mobile-first indexing. This means Google evaluates the mobile version of your site to determine your search engine rankings. Because mobile devices typically have less processing power and slower network connections than desktop computers, your mobile performance score is almost always lower—often by 15 to 25 points.
We recommend running a technical audit at least once a month, or immediately after deploying new themes, major plugins, or structural design updates. If you are new to the platform, you can learn the basics through our guide on how to check site speed on google pagespeed. For a broader look at how speed fits into your technical foundation, you can also read the How to Use PageSpeed Insights to Boost Website Speed (2026 Guide).

Let us walk through running a clean, unpolluted performance test.
When the report loads, you will see a prominent circular score ranging from 0 to 100. It is incredibly tempting to chase a perfect 100/100 score, but this is a common trap that can lead to over-optimization, broken site layouts, and wasted engineering hours.
A score of 90 or above is considered “Good,” 50 to 89 “Needs Improvement,” and 0 to 49 is “Poor.” However, this score is merely a weighted average of simulated lab metrics. It fluctuates between runs due to server load, network variability, and dynamic third-party scripts. A variance of 5 to 10 points between consecutive tests is completely normal.
Instead of obsessing over the score, we must focus on the diagnostic opportunities that directly impact user behavior and search visibility. To understand how these scores translate to real-world marketing value, read our analysis of page speed for seo and our guide on understanding how page speed impact seo strategies.
To use PageSpeed Insights like an expert, you must understand that the tool presents two completely different types of data: Field Data and Lab Data.
Because these two datasets serve different purposes, they can sometimes tell completely different stories. For example, a page might score a 95 in the lab, but show failing field metrics because real-world users are loading the page on older mobile devices in areas with poor cellular coverage.
Conversely, a page might show a low lab score due to strict throttling, while its real-world field metrics are excellent because the core audience uses modern devices on ultra-fast networks. For a deeper dive into these technical differences, consult How To Use PageSpeed Insights: A Detailed Guide | DebugBear.
| Metric Feature | Field Data (CrUX) | Lab Data (Lighthouse) |
|---|---|---|
| Source | Real Chrome Users | Simulated Google Server |
| Timeframe | 28-Day Rolling Average | On-Demand Instant Run |
| Network Conditions | Variable (Real User Networks) | Throttled (Fast 3G Simulation) |
| SEO Impact | Direct Ranking Factor | Indirect Diagnostic Tool |
| Metrics Included | LCP, INP, CLS, FCP, TTFB | LCP, TBT, CLS, FCP, Speed Index |
Google uses three core metrics, known as Core Web Vitals, to measure the user experience. To pass the Core Web Vitals assessment, your page must meet the “Good” threshold at the 75th percentile of all page loads over the 28-day field cycle.
Largest Contentful Paint (LCP): Measures loading performance. It marks the point in the page load timeline when the main content—usually a large hero image or headline—has likely loaded.
Interaction to Next Paint (INP): Measures page responsiveness. It assesses the delay between a user clicking a button, tapping a link, or typing, and the browser visually updating the screen.
Cumulative Layout Shift (CLS): Measures visual stability. It tracks how much elements on the page move around unexpectedly during the loading process, which can cause users to click the wrong button by mistake.
Once you run a test, PageSpeed Insights will generate an “Opportunities” and “Diagnostics” section. These sections list the specific technical issues that are slowing down your page.
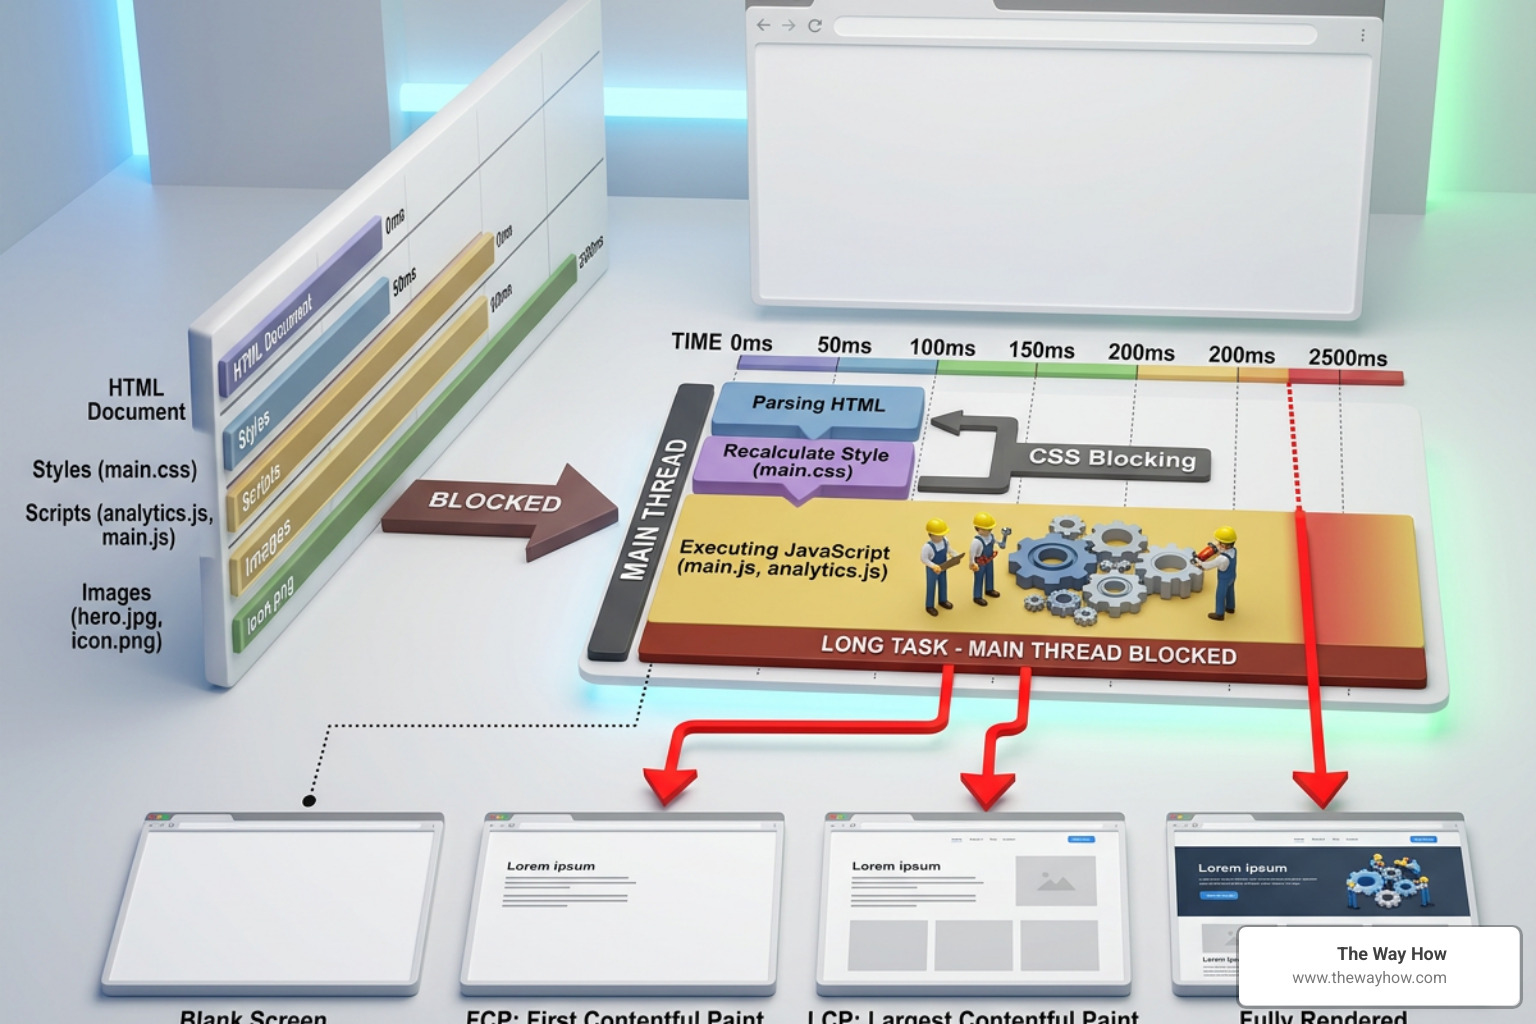
When a browser attempts to render your page, it reads the HTML document from top to bottom. If it encounters a stylesheet (CSS) or a script (JavaScript) in the head of the document, it must pause rendering, download that file, and execute it before it can continue showing the page. These are called render-blocking resources.
To resolve this issue:
defer or async attribute to script tags so they load in the background without blocking the initial page render.If you are running a WordPress site, these optimizations can often be managed through caching and performance plugins. For a detailed roadmap, read our guide on how to optimize wordpress to speed up your website.
Unoptimized images are the single most common cause of high Largest Contentful Paint (LCP) times. If your hero image is a massive 2MB raw file, the browser will struggle to download and display it quickly.
To optimize your images and layout:
srcset attribute to ensure that mobile devices download smaller, resized versions of images rather than the full-sized desktop versions.fetchpriority="high" attribute to tell the browser to prioritize downloading that image first.width and height attributes on your image and video elements. This reserves the correct amount of space on the page before the asset loads, preventing layout shifts and improving your CLS score.For step-by-step instructions on implementing these image fixes, follow our guide on how to optimize images for web a step by step guide for better site performance.
For developers and technical marketers, running manual tests through the web interface is only the first step. To build speed into your development lifecycle, you need advanced workflows.
If you manage a large website with hundreds of pages, manually testing each URL is impossible. Instead, you can use the PageSpeed Insights API to automate your performance monitoring.
To get started with the API:
For a hands-on tutorial on setting up programmatic testing, read the developer codelab: Measure Core Web Vitals with the PageSpeed Insights API and Chrome UX (CrUX) Report API | Google for Developers. You can also refer to Google’s official documentation on how to Get Started with the PageSpeed Insights API | Google for Developers and read About PageSpeed Insights | Google for Developers to understand how the API handles data structures.
No, the public PageSpeed Insights web tool cannot access pages on your local computer (localhost) or pages that require a username and password, because Google’s servers must be able to publicly access the URL.
To test these pages, you should use the Lighthouse tab built directly into Chrome DevTools. This runs the same underlying engine locally on your machine, allowing you to test authenticated pages, staging environments, and local development builds. For automated testing of private pages, you can write a script using Puppeteer to log into your site first, then run the Lighthouse CLI tool.
Lighthouse lab tests run in a simulated environment, meaning your score can fluctuate based on server load, network congestion, and how quickly third-party scripts (like analytics or chat widgets) respond during the test. A 5 to 10-point variance between consecutive tests is completely normal. To get an accurate baseline, run the test three times and take the average of the scores.
No. Google does not use the overall 0-100 Lighthouse Performance score as a direct ranking factor. Instead, Google’s ranking algorithm looks at the real-world Core Web Vitals metrics (LCP, INP, and CLS) from the Chrome UX Report. Focus on passing the Core Web Vitals assessment for your real users rather than obsessing over achieving a perfect 100 lab score.
At The Way How, we look at website performance through the lens of human behavior. A slow website is not just a technical failure; it is a psychological barrier that introduces doubt, friction, and hesitation into the customer journey. When a prospective buyer has to wait for your page to load, their trust in your brand degrades.
Our work blends behavioral insight, operational execution, and strategic clarity to turn your digital presence into a highly efficient, dependable growth engine. We help founders and leadership teams diagnose why growth is stalled, identify certainty gaps in the customer journey, and design high-performance systems that build trust and drive predictable revenue.
If you are ready to stop chasing superficial tactics and start building a high-converting, technically optimized digital platform, explore our strategic services on pagespeed optimization to learn how we can help you turn performance improvements into real business growth.
 Jeremy Wayne Howell : Jul 22, 2026 9:48:31 PM
 Jeremy Wayne Howell : Jul 20, 2026 9:46:47 PM
 Jeremy Wayne Howell : Jul 17, 2026 5:45:00 AM